Interactive Charts with D3.js
You did it! You grabbed a data set and visualized it, right here in the browser. Congratulations, that is no easy feat!
This is 2019 and the web browser opens up a whole new realm of possibilities when visualizing data.
- If a user wonders what the exact value of a data point is, they can hover over it and find out
- We can even show whole charts within a chart tooltip
- We can tell a story with a chart, progressively revealing parts of it as the user scrolls
Let’s take advantage of these new possibilities and talk about how to take your chart to the next level.
Our journey today will go through the following steps, click one to jump ahead:
#Native trigger events
We can interact with the content of a web page in a variety of ways: we can hover elements, click on buttons, and select text, to start.
What are the possibilities with a since DOM element? See how many events you can trigger on these circles:
Log
There are a ton of native events, aren’t there?! Did you find the drag events? Or the double-click event?
Any of these events can be used to trigger an interaction with a data visualization. The most common one is to show a tooltip with more information or detail — we’ll do a deep dive on tooltips further down.
This is just the tip of the iceberg — imagine letting users zoom into part of a chart with a wheel event. Or adding a custom context menu on right click.
#Our chart
Let’s start out with a simple bar chart.
This histogram shows the difference between hours estimated and actual hours for specific tasks. Hovering over a bar triggers a tooltip that explains what the bar is, a few example tasks, and how many tasks fit into the bin.
The tooltip even has a bar that shows what percent of the work was done by developers. Showing a chart within a tooltip can help users dive even further into a dataset, letting them explore additional metrics.
#Getting set up
If you’d like to follow along, download the code on Github.
To get the code running:
- 1.in your Terminal, install live-serverIn your terminal
npm install -g live-server - 2.in your Terminal, start a server in the
examples/folderIn your terminallive-server —open - 3.your browser should open the example automatically, but if it doesn’t, navigate to localhost:8080
- 4.this page should show a directory of folders. Click until you reach
/interactions/-bars-start, or navigate to the url localhost:8080/interactions/-bars-start/
On the rightBelow, you’ll see the full code to create the basic histogram.
At various points in this article, we’ll update the code in the right panel. As you scroll, keep an eye on the icons in the page’s left margin. When the scrolls into the rectangle on the right, the code on the right will update to match the next step.
You can also click on the to trigger the code to update.
This code goes through the 7 basic steps of creating a chart (as outlined in the Fullstack D3 and Data Visualization book).
- 1.Access dataLook at the data structure and declare how to access the values we’ll need
- 2.Create chart dimensionsDeclare the physical (i.e. pixels) chart parameters
- 3.Draw canvasRender the chart area and bounds element
- 4.Create scalesCreate scales for every data-to-physical attribute in our chart
- 5.Draw dataRender your data elements
- 6.Draw peripheralsRender your axes, labels, and legends
- 7.Set up interactionsInitialize event listeners and create interaction behavior
The steps are grouped and collapsable in the code — if you want to learn about these in detail, download the first chapter of the book for free.
We’ll be fleshing out the last step: Set up interactions. Our code draws the complete chart, but doesn’t yet trigger any tooltips.
#How are we drawing this chart?
First, let’s look at how we’re drawing our bars.
In our Draw data step, we’re creating one group (<g> element) for each item in a bins array. Notice that we’re storing a d3 selection object containing these groups in the variable binGroups.
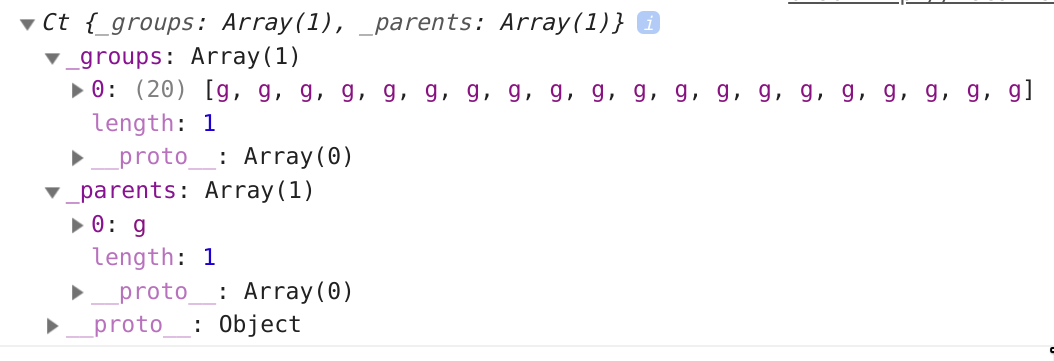
let binGroups = bounds.select(".bins") .selectAll(".bin") .data(bins) binGroups.exit() .remove() const newBinGroups = binGroups.enter().append("g") .attr("class", "bin")But what is a d3 selection object? Whenever we pass a CSS-selector-like string to d3.select() or to d3.selectAll(), we create a new d3 selection object.
Matching DOM elements are stored in a list (represented under the _groups key). There will be other keys in this object, like the selection’s parents (in _parents).
<rect> element for each group and set its position and size, calculated with our already created xScale and yScale. newBinGroups.append("rect") // update binGroups to include new points binGroups = newBinGroups.merge(binGroups) const barRects = binGroups.select("rect") .attr("x", d => xScale(d.x0) + barPadding) .attr("y", d => yScale(yAccessor(d))) .attr("height", d => ( dimensions.boundedHeight - yScale(yAccessor(d)) )) .attr("width", d => d3.max([ 0, xScale(d.x1) - xScale(d.x0) - barPadding ]))#Listening to mouse events
Now that we have an idea of how we’re drawing each of our bars, we can start adding our tooltip.
Let’s move back down to Step 7.
To show a tooltip when a user hovers a bar, we’ll need to trigger changes under two circumstances:
- 1.the mouse enters a bar
- 2.the mouse leaves a bar
Thankfully, d3 selection objects have an .on() method that will execute a function when an event is triggered. .on() takes three parameters:
- 1.typename: the name of a supported DOM event type
- 2.listener (optional): the function to execute when triggered
- 3.options (optional): an object containing native event options, for example
capture
For example, to log "hi" to the console when the body of a page is clicked, we could use the following code:
d3.select("body").on("click", () => console.log("hi"))Let’s create some interactions! Using our binGroups selection, we’ll create one function to run on mouse enter and one function to run on mouse leave.
binGroups.select("rect") .on("mouseenter", onMouseEnter) .on("mouseleave", onMouseLeave) function onMouseEnter(datum) { } function onMouseLeave() { }#Populating our tooltip
If we look at our index.html file, we’ll see that we’ve created a <div> with an id of "tooltip".
<div id="wrapper" class="wrapper"> <div id="tooltip" class="tooltip"> <div class="tooltip-range" id="range"></div> <div class="tooltip-examples" id="examples"></div> <div class="tooltip-value"> ...of <span id="count"></span> tasks </div> <div class="tooltip-bar-value"> <b><span id="tooltip-bar-value"></span>%</b> of the work was done by developers </div> <div class="tooltip-bar"> <div class="tooltip-bar-fill" id="tooltip-bar-fill"></div> </div> </div> </div>Let’s create a d3 selection object that contains our tooltip element.
We’ll create this element outside of our onMouseEnter and onMouseLeave functions, so we don’t have to find it every time we move our mouse.
binGroups.select("rect") .on("mouseenter", onMouseEnter) .on("mouseleave", onMouseLeave) const tooltip = d3.select("#tooltip") function onMouseEnter(datum) { } function onMouseLeave() { }Next, let’s flesh out our onMouseEnter function. First, we’ll want to make our tooltip visible.
tooltip.style("opacity", 1)Progress! Now our tooltip shows up when we hover a bar.
It’ll stay in its default position (top, left) since we’re not yet setting its position.
Now we can start populating the different parts of our tooltip, starting with the title on top.
In index.html, we can see that the title of our tooltip has an id of "range".
<div id="wrapper" class="wrapper"> <div id="tooltip" class="tooltip"> <div class="tooltip-range" id="range"></div> <div class="tooltip-examples" id="examples"></div> <div class="tooltip-value"> ...of <span id="count"></span> tasks </div> <div class="tooltip-bar-value"> <b><span id="tooltip-bar-value"></span>%</b> of the work was done by developers </div> <div class="tooltip-bar"> <div class="tooltip-bar-fill" id="tooltip-bar-fill"></div> </div> </div> </div>We can target this <div> by creating a d3 selection object using the string "#range" (# specifies that we’re looking for elements with a specific id).
.text([When we hover over a bar, we want the title of our tooltip to tell us the range of hours that are included. For example: Over-estimated by 5 to 10 hours. But how do we know what that range is for the bar we're hovering over?
The first parameter of our onMouseEnter() function is the specific data bound to the hovered element. We've named it datum.
datum will correspond to the item in the bins array that we used to create the hovered over bar.
tooltip.select("#range") .text([ datum.x0 < 0 ? `Under-estimated by` : `Over-estimated by`, Math.abs(datum.x0), "to", Math.abs(datum.x1), "hours", ].join(" "))Each item in our bins array contains:
- the list of tasks that fit inside of the bucket
- x0: the smallest number of hours included in the bucket
- x1: the largest number of hours included in the bucket (exclusive)
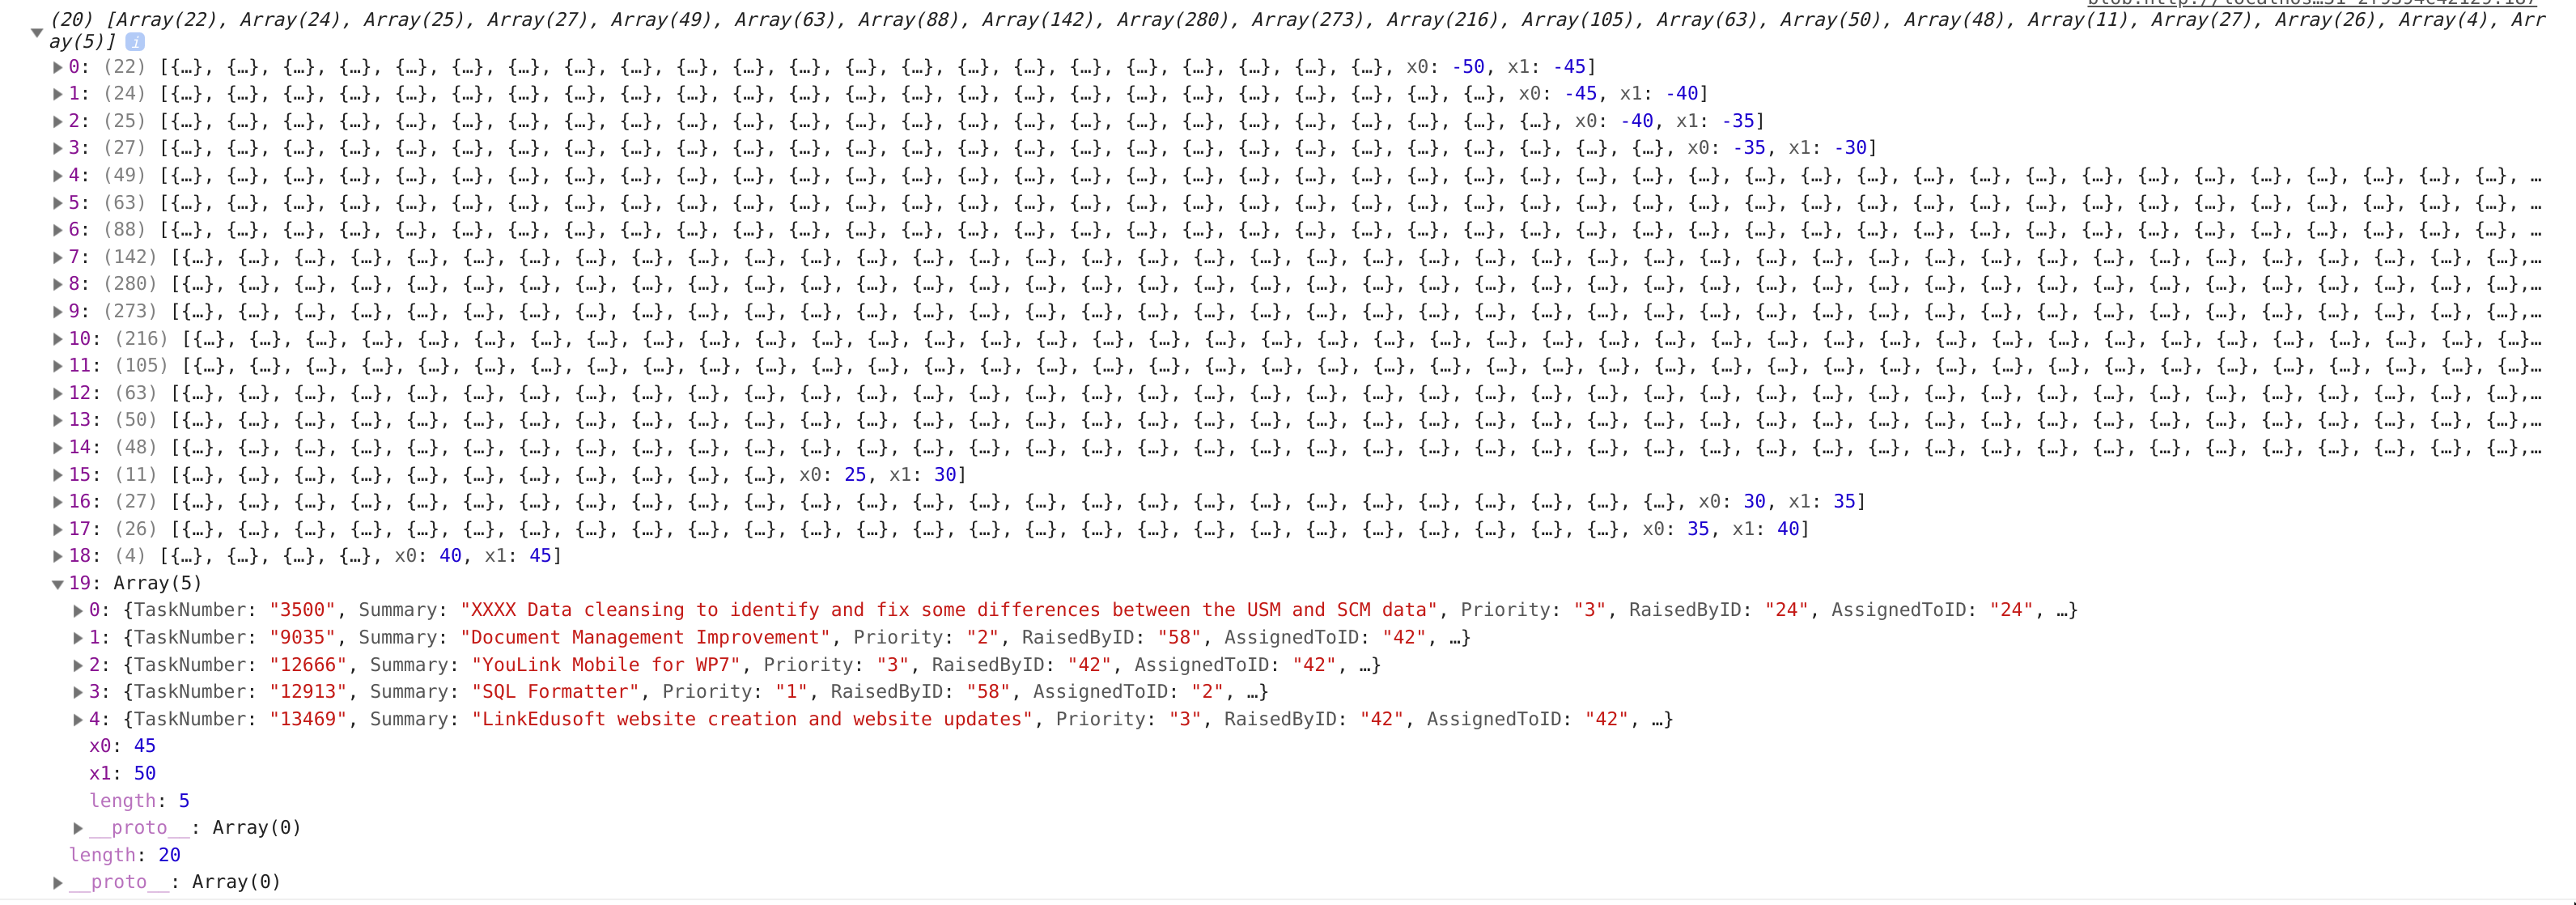
Knowing this, we can find the range of hours for our hovered bar at datum.x0 and datum.x1.
We can change the text inside of this <div> by using the d3 selection object's method .text(). Let's piece together our statement by creating an array of strings and numbers, then glueing them into one string using .join().
Awesome! Now our tooltip's title updates as we move our mouse around.
The phrase Over-estimated by -25 to -20 hours is a little mind-bendy. Let's add some extra logic to handle under- and over-estimating differently. We can use Math.abs() to prevent from showing negative numbers.
That's much better!
Let’s populate the rest of the tooltip.
This example is a little more in-depth, so feel free to breeze through these added lines. If you’re curious, feel free to implement them one-by-one to see how they populate the tooltip.
tooltip.select("#examples") .html( datum .slice(0, 3) .map(summaryAccessor) .join("<br />") ) tooltip.select("#count") .text(Math.max(0, yAccessor(datum) - 2)) const percentDeveloperHoursValues = datum.map(d => ( (developerHoursAccessor(d) / actualHoursAccessor(d)) || 0 )) const percentDeveloperHours = d3.mean(percentDeveloperHoursValues) const formatHours = d => d3.format(",.2f")(Math.abs(d)) tooltip.select("#tooltip-bar-value") .text(formatHours(percentDeveloperHours)) tooltip.select("#tooltip-bar-fill") .style("width", `${percentDeveloperHours * 100}%`)Great! Now we can see our tooltip updating as we hover over different bars:
#Positioning our tooltip
Let’s update the position of our tooltip to sit on top of the bar that we’re hovering over. This will help to reinforce the relationship between the bar and the extra information, as well as decreasing the amount that users have to move their eyes back and forth.
If we look in Step 4, we created an xScale that converts hours over-estimated into an x-position.
We can use our xScale to convert the lower and upper bounds of our hovered bin into x-positions.
For example, xScale(datum.x0) will give us the x-position of the left side of our bin.
To find the middle of our bar, we’ll want to add three numbers together:
- 1.the x-position of the left side of our bar
- 2.half the width of our bar (the x-position of the rightof our bar, minus the x-position of the left side of our bar)
- 3.the size of our left margin
const x = xScale(datum.x0) + (xScale(datum.x1) - xScale(datum.x0)) / 2 + dimensions.margin.leftWe also need to find the y-position of our tooltip.
To find the top of our bar, we’ll want to add two numbers together:
- 1.the y-position of the top of our bar
- 2.the size of our top margin
const y = yScale(yAccessor(datum)) + dimensions.margin.topGreat! Now we just need to use our x and y to position our tooltip.
We can move our tooltip element by setting its CSS transform property.
tooltip.style("transform", `translate(${x}px,${y}px)`)Our tooltip is moving now! But it isn’t aligning with the correct bars!
There are actually two things wrong here, let’s focus on the first:
If we look at the CSS, our tooltip is absolutely positioned:
.tooltip { position: absolute;Absolutely positioned elements are positioned relative to their containing block. How are containing blocks created for an absolutely positioned element?
Our tooltip will be positioned based on the edge of the padding box of the nearest ancestor element that has:
- a position value other than
static(fixed,absolute,relative, orsticky). - a
transformorperspectivevalue other than none - a
will-changevalue oftransformorperspective - A
filtervalue other than none or awill-changevalue offilter(only on Firefox). - A
containvalue ofpaint
Because none of these apply to any of our chart’s ancestor elements, our tooltip will be positioned relative to the initial containing block (basically what the <html> element covers).
Instead, we want to position our tooltip based on the top, left corner of our chart’s wrapper element. Let’s give this element one of the properties in the list above: the easiest is to set the position to relative. This won’t have an effect on the element, since relative acts very similar to the default static.
.wrapper { position: relative;}Something is else wrong here — our tooltip is moving to the top of our hovered bar, but we’re aligning the top, left corner.
Instead, we want to align the bottom, middle edge to the top of our hovered bar.
We want our tooltip to shift left by 50% of its own width and up by 100% of its own height. There are several ways to use CSS to position an element using percent, and each way uses the percent of a different value:
topandbottompercentage of the parent element’s widthleftandrightpercentage of the parent element’s heightmarginpercentage of the parent element’s width (even thetopandbottommargins)transform: translate()percentage of the specified element’s height and width
Since we want to shift our tooltip by its own height and width, we’ll need to use the transform: translate() CSS property. But we’re already using it to set the overall position.
Thankfully, we can use the CSS calc() function! CSS calc() lets you specify a value using multiple units. For example, an element with the rule width: calc(100% + 20px) will be 20 pixels wider than its context.
Let’s use calc() to also shift our tooltip left by -50% of its width and up by 100% of its height.
tooltip.style("transform", `translate(` + `calc( -50% + ${x}px),` + `calc(-100% + ${y}px)` + `)`) }Perfect! Now our tooltip is correctly positioned above any bar that we hover.
#Finishing tweaks
Our tooltip is sticking around, obscuring part of the chart. When our mouse leaves a bar, let’s remove the tooltip to clear the view.
tooltip.style("opacity", 0)Lastly, let’s highlight the bar that we’re hovering over, making it easier to focus on it.
We could update its fill in our onMouseEnter and onMouseLeave functions, but there’s a simpler way.
We can insert a CSS selector in our styles.css file, targeting any .bin that is being :hovered.
.bin:hover { fill: #22a6b3;}There we go!
It’s always good to be aware of multiple ways of doing things, and the benefits of each. My general rule of thumb is to use a CSS style when possible, especially when the change is more of a decorative style or uses SASS/LESS variables.
#Make the interaction as easy as possible
While the tooltip we just created is wonderful and helpful, it could be easier to trigger. The easier a chart is to interact with, the more likely a user is to interact with it.
Until now, we’ve been using existing elements to trigger mouse events. What if we created new elements to trigger those events? This opens up tons of new possibilities.
What would the ideal hover event be? Let’s make it so that hovering anywhere on our chart will trigger a tooltip.
We’ll want to create new bars on top of our existing bins, but these will cover the full height of our bounds.
At the top of our Set up interactions step, we’ll create these new bars and attach our listener events to them.
const barRectsListeners = bounds.selectAll(".listeners") .data(bins) .enter().append("rect") .attr("class", "listeners") .attr("x", d => xScale(d.x0)) .attr("y", -dimensions.margin.top) .attr("height", dimensions.boundedHeight + dimensions.margin.top) .attr("width", d => d3.max([ 0, xScale(d.x1) - xScale(d.x0) ])) .on("mouseenter", onMouseEnter) .on("mouseleave", onMouseLeave)We’re also ignoring the padding between our bars, making them flush against each other. This will prevent our tooltip from flickering when our mouse is in-between two bars.
Since our new bars will have a default fill of black, let’s update that in our styles.css file so that they’re not obstructing our existing chart.
.listeners { fill: transparent;}Note that we want to keep the bars there to capture the pointer events, we just want them to have a transparent fill.
Notice how much easier it is to interact with our chart now?
:hover styles, though, since our new bars are capturing the hover events.When we draw our .bins in our Draw data step, let’s give them a key attribute that we can target.
We’ll use the index of the bin as an identifier, since it will be consistent between both sets of bars.
.attr("key", (d, i) => i)The second parameter .on() sends to its callback is the index of the d3 selection object.
function onMouseEnter(datum, index) {Let’s assign this index to the variable index.
At the bottom of our onMouseEnter() function, we can find the corresponding .bin and add a class to it: hovered.
const hoveredBar = binGroups.select(`rect[key='${index}']`) hoveredBar.classed("hovered", true) barRects.classed("hovered", false)Lastly, we’ll need to add one more rule to our styles.css file.
Let’s want to add a fill to elements with a class of hovered, since we can no longer use the :hover pseudo-class.
.hovered { fill: #22a6b3;}And voila! Now our bar changes color on hover again.
Take a minute to compare our new version (above) with the first version we made (below). Which one is more enjoyable to interact with?
#Taking it further
In this exercise, we learned a few fundamental concepts:
- how to trigger changes to our chart based on native event listeners
- how to update the contents of a tooltip
- how to position a tooltip
- to create new elements to get more fluid interactions
Stay tuned!
In the next post, we’ll explore how to add tooltips to a scatter plot. To do this well, we’ll create extra elements similar to our last series of bars, but this is tricker to do with irregularly-spaced elements.
After that, we’ll explore how to add a tooltip to a line chart. We’ll learn how to find the exact mouse position and search for the closest data point.
I'll be posting updates on Twitter, feel free to follow me if you want to be notified of updates. Or share any thoughts about this article. Thanks for reading!